13 afleveringen

12: Real Lessons from Building a Data Literacy Program with Neil Richards
10-12-2025 | 42 Min.
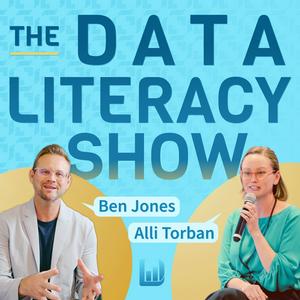
In this episode of The Data Literacy Show, Ben Jones (CEO of Data Literacy) and Alli Torban (Senior Data Literacy Advocate) talk with Neil Richards, an award-winning data visualization expert and former Global Data Fluency Lead at JLL, about what it really takes to build and sustain a data literacy program inside an organization. He’ll share tips on…Securing early wins and leadership buy-inLittle “data moments” to integrate data into the organization cultureRecognizing the shifts that show your program is workingAnd more!Show notes: https://dataliteracy.com/episode-12

11: Should We Use AI Agents?
18-11-2025 | 28 Min.
In this episode of The Data Literacy Show, Ben Jones (CEO of Data Literacy) and Alli Torban (Senior Data Literacy Advocate) share a practical framework to help you identify strong AI automation candidates, reduce risk, and keep quality high over time.Topics covered:How to use the Frequency–Complexity Matrix to spot good automation opportunitiesHow to evaluate a task’s exception rate and decide between full or hybrid automationHow to estimate recovery cost so you can start automating safelyThe four categories of Automation Health Metrics every team should monitorWhy humans still play a critical role in trusted automationLinks mentioned:Show notes: https://dataliteracy.com/episode-11Waitlist for our new course Enhancing Your Workflow with AI: https://dataliteracy.com/enhancing-your-workflow-with-ai/

10: Practical Steps for a Strong AI Strategy
27-10-2025 | 35 Min.
In this episode of The Data Literacy Show, Ben Jones (CEO of Data Literacy) and Alli Torban (Senior Data Literacy Advocate) share what makes a strong AI strategy and guide you through the first steps to building one for your organization.Topics covered:What an AI strategy is and the seven important parts of a strong AI strategyCommon mistakes organizations makeThe first three practical steps to take when defining your AI strategyLinks mentioned:The Data Literacy Score and the AI Literacy ScoreEpisode show notes: http://dataliteracy.com/episode-10

09: Which Training Style is Best for Your Team? Pros/Cons of Top Modalities
29-9-2025 | 31 Min.
In this episode of The Data Literacy Show, hosts Ben Jones (CEO of Data Literacy) and Alli Torban (Senior Data Literacy Advocate) share the most common training styles (on-demand, live virtual, in-person, hybrid, cohort-based, and project-based) and the pros and cons of each.Topics covered:Why on-demand training is great for scalability but often needs added accountabilityHow live virtual sessions boost real-time engagement but can be draining if poorly scheduledWhat makes in-person workshops powerful for retention and connection, despite the higher costWhy project-based training is the gold standard for applied results, and when it works bestLinks mentioned:Data Storytelling for IMPACT On-Demand CourseEpisode show notes: http://dataliteracy.com/episode-09

08: 3 Chart Swaps to Make Your Graphics More Effective
27-8-2025 | 18 Min.
In this episode of The Data Literacy Show, hosts Ben Jones (CEO of Data Literacy) and Alli Torban (Senior Data Literacy Advocate) share 3 smart chart swaps that instantly improve the clarity and impact of your data graphics. Whether you're presenting to executives or designing reports, these quick swaps help your audience grasp what matters.Topics covered:Why using two pie charts to show change over time is hard to read, and what to try insteadHow small multiples can solve the problems of cluttered stacked bar chartsWhen to swap a bullet chart for a diverging bar chart to better show performance vs. targetLinks mentioned:Level 1: Learning to See Data on-demand course: learn the building blocks of charts, common types, when to use them, and more.Episode show notes: http://dataliteracy.com/episode-08
Meer Technologie podcasts
Trending Technologie -podcasts
Over The Data Literacy Show
Luister naar The Data Literacy Show, Tech Update | BNR en vele andere podcasts van over de hele wereld met de radio.net-app
Ontvang de gratis radio.net app
- Zenders en podcasts om te bookmarken
- Streamen via Wi-Fi of Bluetooth
- Ondersteunt Carplay & Android Auto
- Veel andere app-functies
Ontvang de gratis radio.net app
- Zenders en podcasts om te bookmarken
- Streamen via Wi-Fi of Bluetooth
- Ondersteunt Carplay & Android Auto
- Veel andere app-functies

The Data Literacy Show
download de app,
luisteren.
